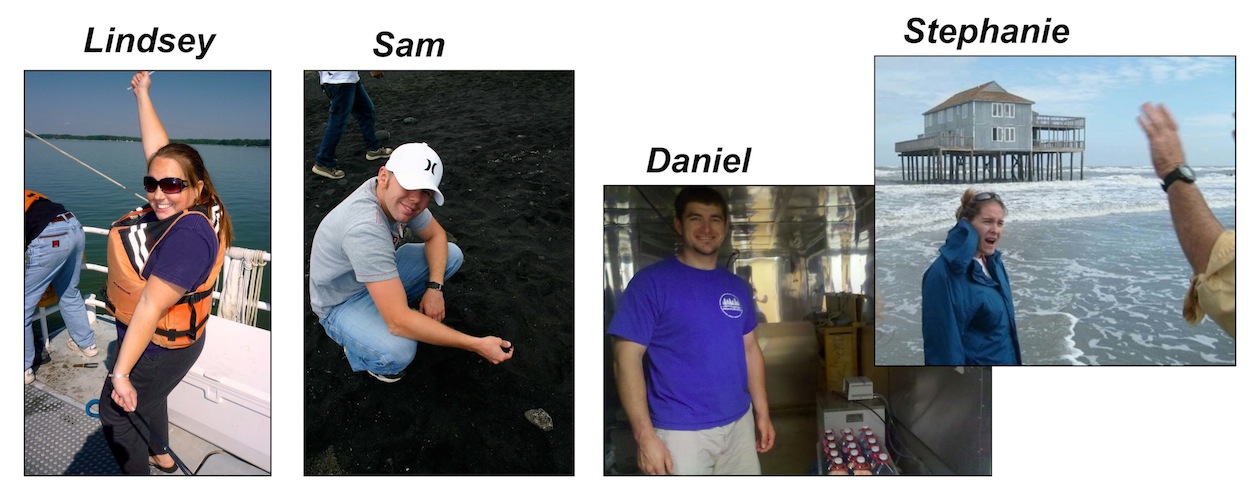
[This guest post comes from VIMS graduate students Lindsey Kraatz, Sam Lake, Daniel Maxey, and Stephanie Salisbury]
Have you ever walked down a street and seen someone so big, so athletic looking that you instantly thought to yourself “WOW, they must be a football player, they’re huge!”? What about a high-class businessman or a runway model, or maybe a soccer mom driving a mini van? We all have preconceived notions about what how certain people or occupations should look.

 But what about scientists? What comes to mind when you picture an average scientist? Do you instantly think of a nerdy Bill Nye who wears coke-bottle thick glasses and a lab coat with a pocket protector? Or do you picture someone breaking stereotypical barriers like Abby on NCIS?
Over the last two years a group of us, graduate student Fellows in the National Science Foundation GK-12 program at the Virginia Institute of Marine Science, set out to answer these questions. We wanted to know what local middle and high school students perceived to be a “normal” scientist, and to find out if interacting with real scientists over the course of a school year might change the students’ perceptions. Here’s what we found out:
The inspiration for our project was a classic study by the anthropologists Margaret Mead and Rhoda Métraux, who surveyed 35,000 high school students and analyzed essays on their thoughts about science and scientists in the 1950’s.
A decade later, David Chambers elaborated on that study by incorporating student drawings into the analysis, creating what is now referred to as the “Draw a Scientist Test” (DAST) survey. After surveying over 4800 students over 11 years, Chambers found that seven key attributes were commonly depicted in student drawings:
1. Lab coat (typically white)
2. Eye Glasses
3. Facial Hair
4. Symbols of Research (Beakers, test tubes, microscope, etc)
5. Symbols of Knowledge (Books, skeletons, equations, etc.)
6. Technology (Computers, lab machines, etc)
7. Relevant Caption (Eureka!, etc.)
Some things seemingly never change. Even today, when you Google “images of scientists” you see many of these same attributes:
For our study, we asked students to imagine and draw what they perceived to be a “typical” scientist. They then answered three questions about their drawings: 1) In two sentences, describe what your scientist is doing in YOUR drawing, 2) List 3 words that come to mind when you look at YOUR scientist, and 3) What do you think scientists do on a TYPICAL day?
One of the primary goals of this ongoing project is to improve on previous DAST rubrics and develop a novel approach for analyzing student perceptions. We evaluated each image to classify aspects including personal characteristics, symbols of research, gender, etc. Key modifications we made included the addition of experimental location (lab vs. field) and highlighting marine science characteristics (boat, scuba, etc).
So far, we’ve surveyed students at the beginning of the school year (before meeting us in their classrooms) and then again at the end of their first semester.
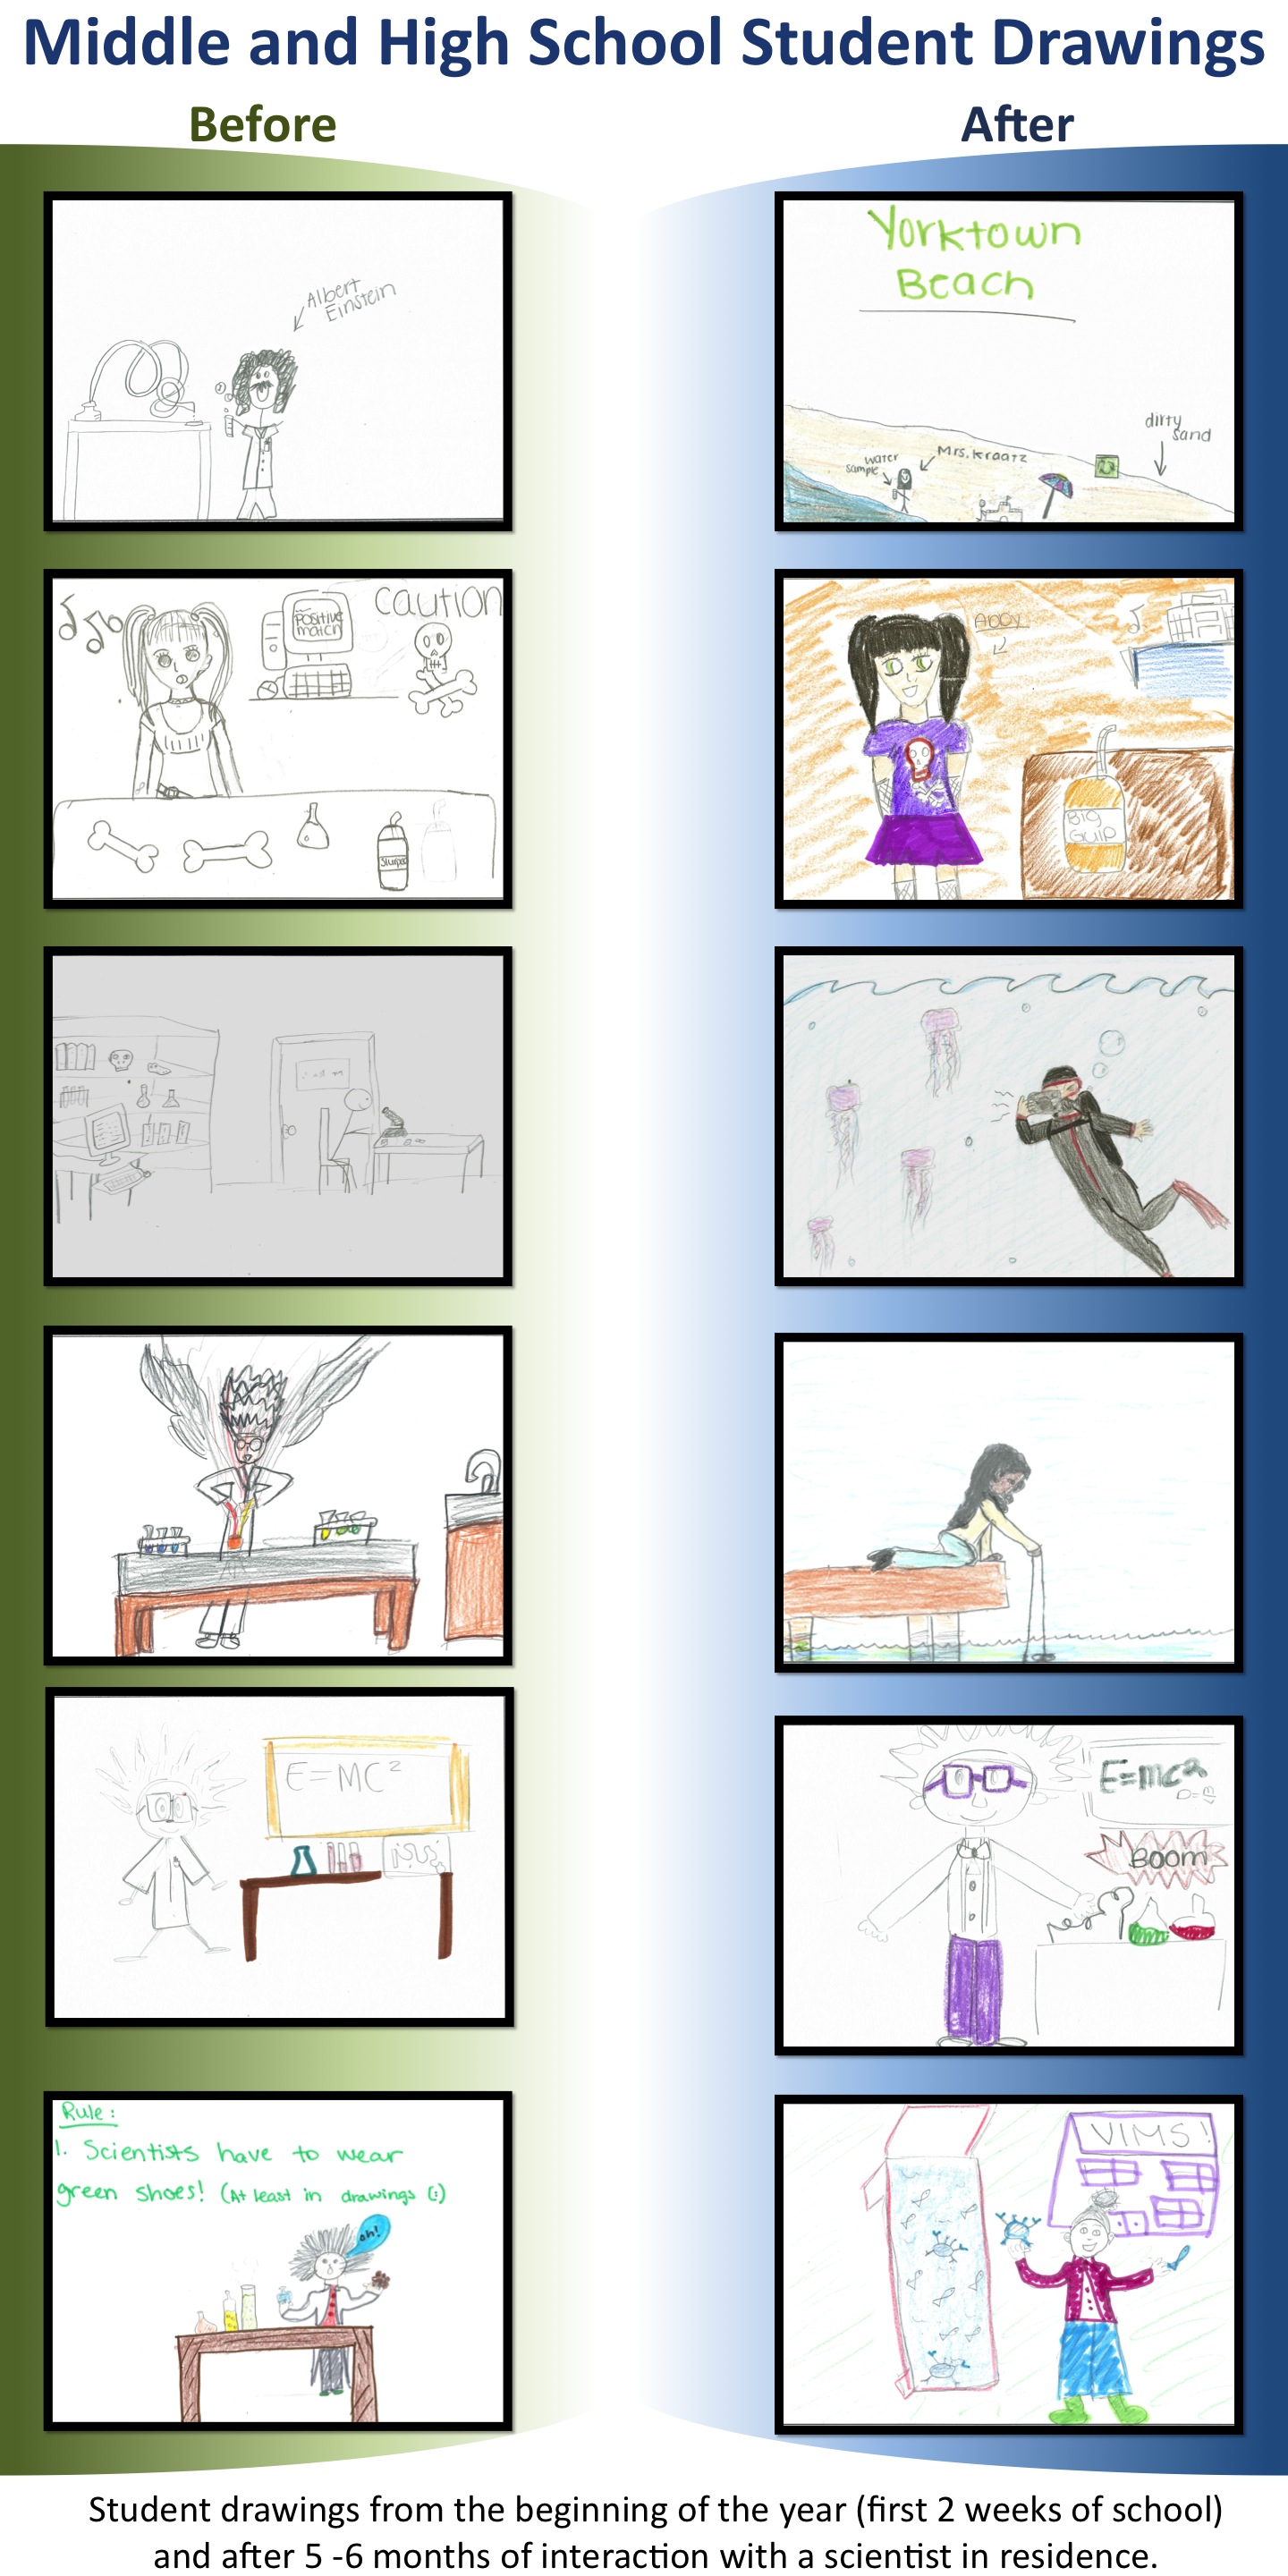
What did we find out? Across all of the schools there was a shift from the “geeky” scientist in the lab to (arguably less geeky) individuals in the field conducting research:
Interestingly, all of us noticed an increase in female scientists in the drawings after interaction with scientists in the classroom. Initially, almost 80% of scientists drawn by students were male, but after 4-5 months this proportion fell to only 60%. This is probably because the fellows found many students were drawing themselves or their respective GK-12 scientist.

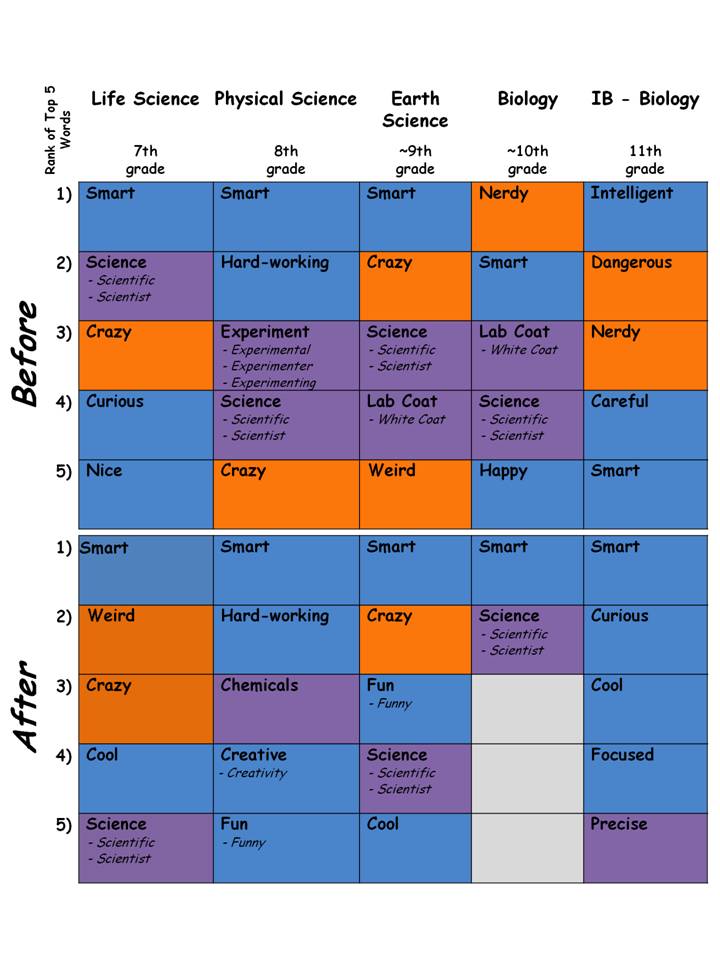
Other trends observed in the analysis include the choice of words used to describe a “typical” scientist, career choice depicted in the drawings, location of experiments, and other general characteristics of the images. Overall, the VIMS “PERFECT” GK-12 fellows found students’ perceptions of scientists was more positive both in the images drawn and in words used to describe them after getting to know their “Scientist in Residence” for a semester in the classroom.
So what’s next?
Several of us will be analyzing all the data. including the new results from end-of-the-year surveys (~10 months) to look for additional trends in the drawings and to compare those results to drawings collected in a “control” classroom where no GK-12 fellow was present. But we feel that the real take-home message is that we are all scientists — whether we’re discovering a new fish species or figuring out which laundry detergent will get the stain out of our new shirt the best. We all hypothesize scientific theories on a daily basis, even if we don’t think about it using those words.
So . . . the next time you see that athletic looking jock walking down the street, think to yourself, “He might be the star scientist that plays football!”
Stay tuned for the final results of the study!
The VIMS GK-12 DAST Scientists: Lindsey Kraatz, Sam Lake, Daniel Maxey, and Stephanie Salisbury


Leave a Reply