There has been a lot going on with climate change science recently. And Iv’e been writing a review paper on climate change and marine communities and have been impressed with how rapidly the field is developing. Just a hint of what is out there:
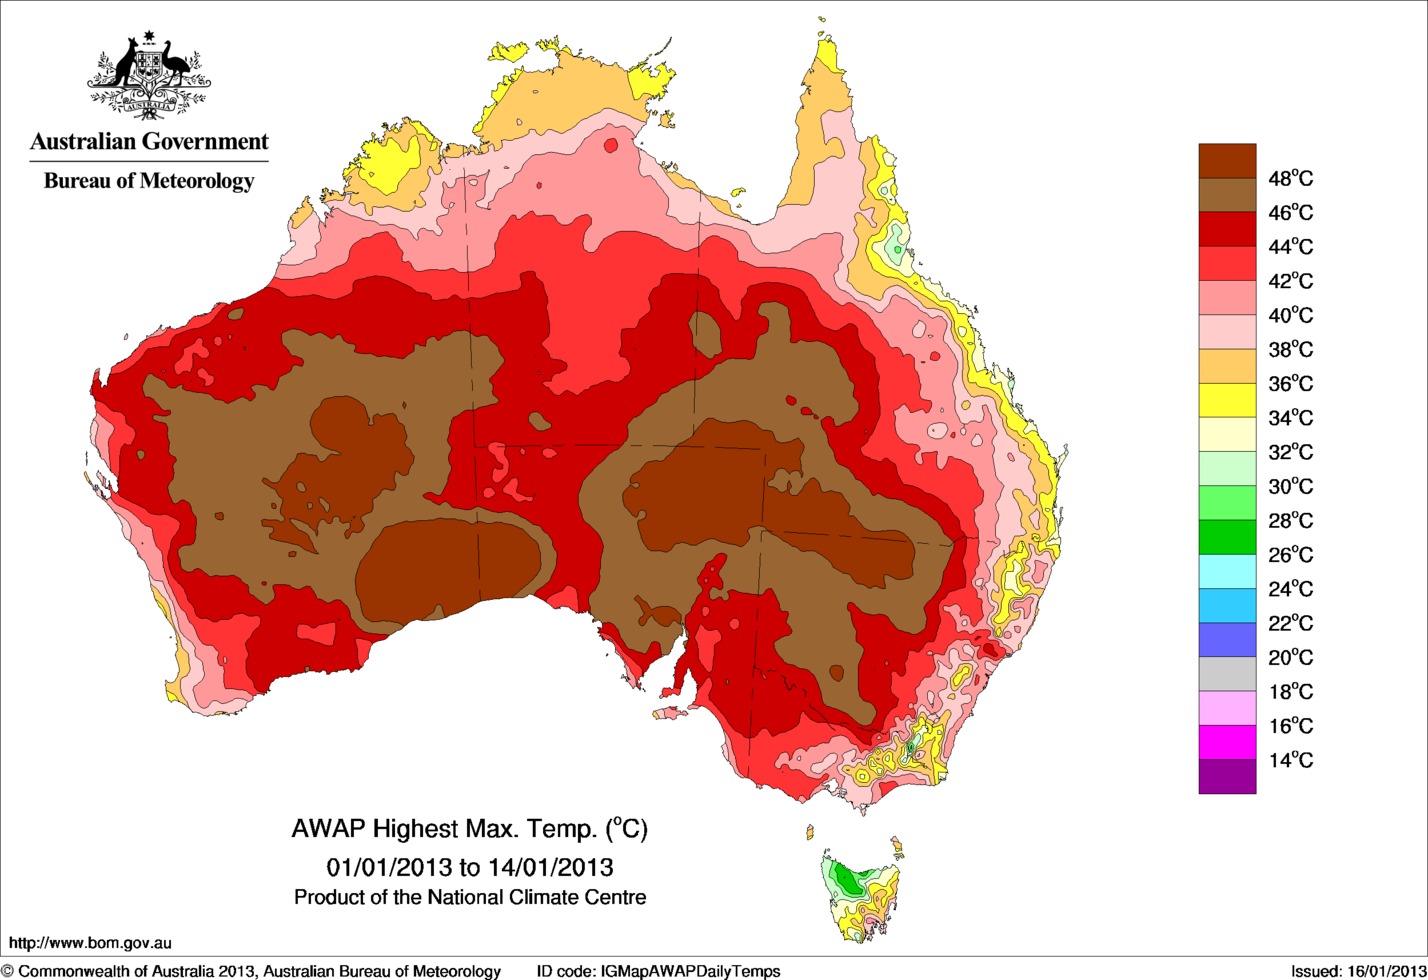
The Australian heat wave
This is one of the big stories of early 2013. From the Conversation, What’s causing Australia’s heat wave? Australia has started 2013 with a record-breaking heat wave that has lasted more than two weeks across many parts of the country. Temperatures have regularly gone above 48°C, with the highest recorded maximum of 49.6°C at Moomba in South Australia. The extreme conditions have been associated with a delayed onset of the Australian monsoon, and slow moving weather systems over the continent.
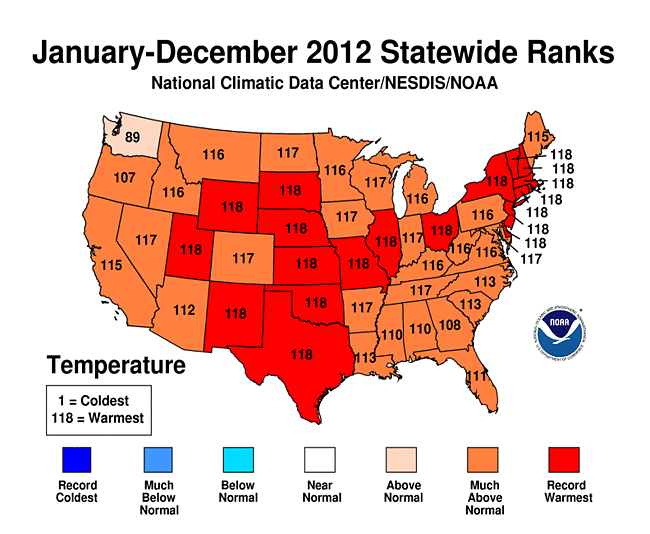
2012 was warmest year on record in the US and the ninth warmest globally
From NASA 2012 was the ninth warmest of any year since 1880, continuing a long-term trend of rising global temperatures. With the exception of 1998, the nine warmest years in the 132-year record all have occurred since 2000, with 2010 and 2005 ranking as the hottest years on record. The average temperature in 2012 was about 58.3 degrees Fahrenheit (14.6 Celsius), which is 1.0 F (0.6 C) warmer than the mid-20th century baseline. The average global temperature has risen about 1.4 degrees F (0.8 C) since 1880, according to the new analysis.
From NOAA In 2012, the contiguous United States (CONUS) average annual temperature of 55.3°F was3.2°F above the 20th century average, and was the warmest year in the 1895-2012 period of record for the nation. The 2012 annual temperature was 1.0°F warmer than the previous record warm year of 1998. Since 1895, the CONUS has observed a long-term temperature increase of about 0.13°F per decade.
No, global warming hasn’t “paused” or slowed down
from Kevin C at SkS, 16 more years of global warming: Human greenhouse gas emissions have continued to warm the planet over the past 16 years. However, a persistent myth has emerged in the mainstream media challenging this. Denial of this fact may have been the favorite climate contrarian myth of 2012, first invented by David Rose at The Mail on Sunday with an assist from Georgia Tech’s Judith Curry, both of whom later doubled-down on the myth after we debunked it. Despite these repeated debunkings, the myth spread throughout the media in various opinion editorials and stunts throughout 2012. The latest incarnations include this article at the Daily Mail, and a misleadingly headlined piece at the Telegraph.
As a simple illustration of where the myth goes wrong, the following video clarifies how the interplay of natural and human factors have affected the short-term temperature trends, and demonstrates that underneath the short-term noise, the long-term human-caused global warming trend remains as strong as ever.
In particular, once the short-term warming and cooling influences of volcanic eruptions, solar activity, and El Niño and La Niña events are statistically removed from the temperature record, there is no evidence of a change in the rate of greenhouse warming. This replicates the result of a study by Foster and Rahmstorf (2011) under slightly different assumptions.
- The 16-year temperature trend provides no evidence to suggest that human-caused greenhouse warming has slowed.
- The 16-year temperature trend provides no evidence to suggest that the consensus understanding of human-caused climate change is incorrect.
- The temperature record over the past 35 years is consistent with climate change being driven by human greenhouse gas emissions.
http://www.youtube.com/watch?v=u_0JZRIHFtk&
Sea-level rise
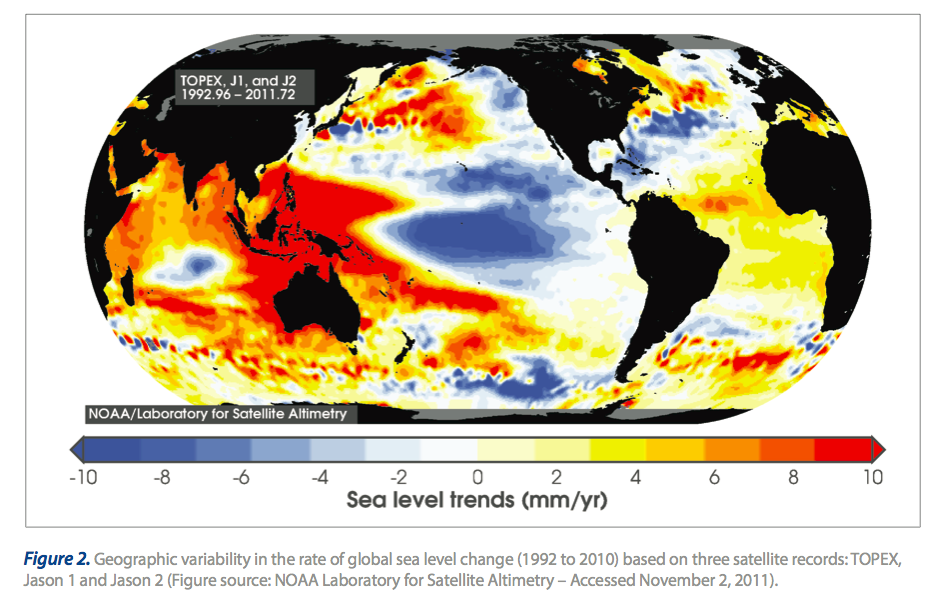
There are several big reports out on regional and national sea level rise trends and projections. Lets start with a summary from RealClimate, Sea-level rise: Where we stand at the start of 2013: Progress has been made in recent years in understanding the observed past sea-level rise. As a result, process-based projections of future sea-level rise have become dramatically higher and are now closer to semi-empirical projections. However, process-based models still underestimate past sea-level rise, and they still project a smaller rise than semi-empirical models.
Sea-level projections were probably the most controversial aspect of the 4th IPCC report, published in 2007. As an author of the paleoclimate chapter, I was involved in some of the sea-level discussions during preparation of the report, but I was not part of the writing team for the projections. At the core of the controversy were the IPCC-projections which are based on process models (i.e. models that aim to simulate individual processes like thermal expansion or glacier melt). Many scientists felt that these models were not mature and understated the sea-level rise to be expected in future, and the IPCC report itself documented the fact that the models seriously underestimated past sea-level rise. (See our in-depth discussion published after the 4th IPCC report appeared.) That was confirmed again with the most recent data in Rahmstorf et al. 2012. Much higher projections than IPCC are also a consistent feature of more recent assessments published since 2007, e.g. the Antarctic Science Report, the Copenhagen Diagnosis, the Arctic Report of AMAP and the recent World Bank Report. Higher projections are also commonly used in coastal planning, e.g. in the Netherlands, in California and North Carolina, and included in the recommendations of the US Army Corps of Engineers. And last month NOAA published the following new sea-level scenarios for the US National Climate Assessment: read the rest here
There is also a nice synthesis out from the National Academy here Sea-Level Rise for the Coasts of California, Oregon, and Washington: Past, Present, and Future: Tide gages show that global sea level has risen about 7 inches during the 20th century, and recent satellite data shows that the rate of sea-level rise is accelerating. As Earth warms, sea levels are rising mainly because: (1) ocean water expands as it warms; and (2) water from melting glaciers and ice sheets is flowing into the ocean. Sea-level rise poses enormous risks to the valuable infrastructure, development, and wetlands that line much of the 1,600 mile shoreline of California, Oregon, and Washington. As those states seek to incorporate projections of sea-level rise into coastal planning, they asked the National Research Council to make independent projections of sea-level rise along their coasts for the years 2030, 2050, and 2100, taking into account regional factors that affect sea level.
- Melting of land ice is now the largest component of global sea-level rise (about 65%), largely because ice loss rates are increasing.
- Global sea level is projected to rise 8-23 cm (3-9 in) by 2030, relative to 2000 levels, 18-48 cm (7-19 in) by 2050, and 50–140 cm (20-55 in) by 2100.
- Vertical land motions caused by plate tectonics and the ongoing response of the Earth to the disappearance of North American ice sheets have a significant impact on sea-level rise along the Washington, Oregon, and California coasts.
- Sea level along the California coast south of Cape Mendocino is projected to rise 4-30 cm (2-12 in) by 2030, relative to 2000 levels, 12-61 cm (5-24 in) by 2050, and 42-167 cm (17-66 in) by 2100. These projections are close to global sea-level rise projections.
- For the Washington, Oregon, and California coasts north of Cape Mendocino, sea level is projected to change between -4 cm (-2 in) (sea-level fall) and +23 cm (9 in) by 2030, -3 cm (-1 in) and +48 cm (19 in) by 2050, and 10-143 cm (4-56 in) by 2100. These values are lower than projections further north.
- Uncertainties grow as the projection period lengthens. Confidence in the projections is high for 2030 and perhaps 2050. By 2100, we are confident only that the value will fall within the uncertainty bounds.
- Most coastal damage is caused by the confluence of large waves, storm surges, and high astronomical tides during a strong El Niño.
- Some models predict a northward shift in North Pacific storm tracks, and some observational studies report that largest waves are getting higher and winds are getting stronger. Observational records are not long enough to confirm whether these are long-term trends.
- Even if storminess does not increase in the future, sea-level rise will magnify the adverse impact of storm surges and high waves on the coast.
- Storms and sea-level rise are causing coastal cliffs, beaches, and dunes to retreat at rates from a few cm/yr to several m/yr. Cliffs could retreat more than 30 m (about 100 feet) by 2100.
- Wetlands are likely to keep pace with sea level until 2050. Their survival until 2100 depends on maintaining elevation through high sedimentation, room to move inland, or uplift.
And a national report from NOAA Global Sea Level Rise scenarios for the United States National Climate Assessment PDF:


Leave a Reply