This is the third installment of my serialization of a new book chapter on “Climate Change and Marine Communities” written with Chris Harley and Mike Burrows. It is for a new book “Marine Community Ecology and Conservation” that I’m co-editing with Mark Bertness, Brian Silliman, and Jay Stachowicz. The book is more or less a followup to the best-selling 2001 edition (which is out of print and worth $100 used and $500 new at Amazon!). We asked our authors to tell us what has happened over the last 10 years in their assigned subfield. The chapters are amazing. And I am truly blown away by how much we’ve discovered since the publication of the first edition! Many fields have been revolutionized and many-a-paradigm has been overturned. Cool stuff.
Ocean warming
Sunlight naturally warms the upper layers of the ocean. When the earth’s energy budget is in equilibrium, this heat is eventually returned to the atmosphere though thermal convection (because the atmosphere is generally cooler than the ocean surface). But an energy imbalance leads to the oceans either gaining or losing heat. Because it is in contact with the atmosphere, the ocean is also warmed by the supercharged greenhouse effect. In fact, approximately 84% of the excess heat being retained via climate change is going into the oceans (Levitus 2005).
Ocean warming is occurring at all depths (Fig. 2A) and has been since at least since the 1980s (Purkey and Johnson 2010, Levitus et al. 2012). Heat gained in surface layers is transferred to the deep ocean by vertical circulation. The global average warming rate (since 1960) for the upper 700 m of the oceans is estimated to be 0.1º C / decade (Casey and Cornillon 2001, Burrows et al. 2011, IPCC 2007), while the deep ocean (700-2000 m) is warming more slowly (Purkey and Johnson 2010). However, such global averages obscure enormous differences among regions and years. For example, the warming in the arctic has been much greater (Fig. 2 B) while some small regions such as the upwelling region off the west coast of North America has cooled somewhat (Fig. 2B). The same patchiness in temperature change has been observed in the deep sea. For instance, the deep southern ocean appears to be warming relatively quickly, at about 0.03 / decade (Purkey and Johnson 2010).
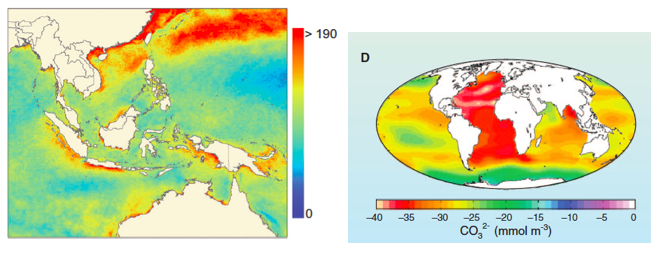
 Figure 2. (A) Changes in the heat content of the land and sea as a result of greenhouse gas emissions. (From Nuccitelli et al. 2012) (B) Trends in ocean surface temperatures for 1980–2011 (Hadley Centre data set Had1SST 1.1). (C) Cumulative number of weeks with sea surface temperature anomalies >1º C (1985–2005) in the Indo-Pacific. (From Selig et al. 2010) (D) Estimated change in sea surface carbonate ion concentration between the pre-industrial period (1700s) and the 1990s. Global Ocean Data Analysis Project. (From Hoegh-Guldberg and Bruno 2010)
Variability in the long-term trend is a fundamental characteristic of how greenhouse gas emissions are altering the physical and chemical properties of the ocean. This patchiness is apparent even at relatively small (by oceanographic standards) spatial scales (Figs. 2 B & C). For example, the average size of high temperature anomalies that cause coral bleaching are only ~ 50 km2 (Selig et al. 2010). This can lead to striking differences among neighboring reefs in terms of historical temperature patterns, the frequency and severity of anomalies, and the biological responses to them (Berkelmans 2002, Berkelmans et al. 2004). Furthermore, these fine-grained hot spots do not appear to be stationary as once assumed. If true, this would pose a huge challenge for coral reef management, much of which is premised on idea that warming extent is spatially constant and predictable.
Ocean acidification
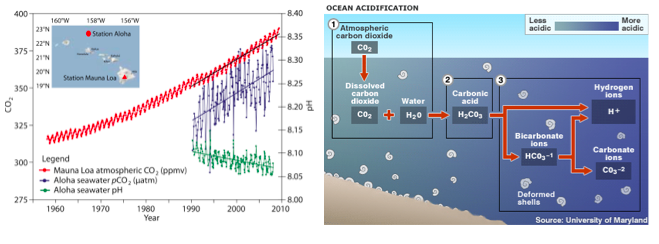
Approximately 25% of the CO2 emitted since the industrial revolution is now dissolved in seawater. When CO2 is absorbed by the ocean it combines with water to form carbonic acid (H2CO3), which then dissociates to become bicarbonate (HCO3-1) and hydrogen ions (H+). Some of the liberated hydrogen ions further interact with carbonate (CO3-2) to create more bicarbonate (Fig. 3). The remainder of the hydrogen ions remain in solution, resulting in a reduction in pH (Orr et al. 2005). This process is called “ocean acidification” (OA), although, technically, seawater is not expected to become an acid (defined as pH < 7). The average pH of the surface ocean has fallen from 8.2 in 1750 to 8.1 in 2000 (Doney et al. 2009b); a 30% increase in acidity. Like ocean warming, the degree to which the concentration of carbonate ions (and pH) has been reduced by acidification varies greatly (Fig. 2D).
 Figure 3. Ocean acidification. (left) Time series data of atmospheric CO2, ocean surface pCO2 and seawater pH (Doney et al. 2009a). (right) The chemical process of ocean acidification.
Other chemical and physical changes to the oceans caused by emissions
Increased UVB: In addition to warming and acidification, emissions are causing a variety of other physical changes to the oceans. For example, past emissions of chlorofluorocarbon compounds (CFCs) depleted the atmospheric ozone, increasing ultraviolet B radiation at the sea surface, especially in the southern hemisphere. Small increases in UVB exposure can greatly decrease the survival of larvae and other sensitive marine organisms (Llabrés et al. 2013).
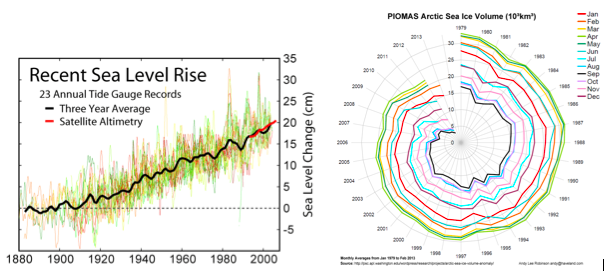
Rising sea level: Greenhouse gas emissions are causing sea level to rise via “thermal expansion” (warming water above 4°C increases its volume) and by melting glaciers (Fig. 4A). Until human activities increased the concentration of greenhouse gases in the earth’s atmosphere, global sea level had been relatively stable for several thousand years (Gehrels et al. 2006). Currently, sea level is rising and the rate of sea level rise appears to be accelerating (Church et al. 2008). Sea level rise is highly variable in space and time due both to underlying geological dynamics and ocean surface wind patterns (Nicholls and Cazenave 2010). Sea level rise will challenge coastal ecosystems including coral reefs, salt marshes, and mangrove forests as they cope with other threats while simultaneously needing to accrete at higher rates or migrate landward.
Salinity: Even sea surface salinity is changing due an intensification of the global water cycle, caused by atmospheric warming (Durack et al. 2012). In the open ocean, relatively fresh areas that are dominated by precipitation are expected to become fresher, and the converse is true of relatively salty, evaporation-dominated regions. Patterns of estuarine salinity may change dramatically due to changes in the timing and magnitude of precipitation and snowmelt in the watershed. Changing salinity gradients could also alter large-scale ocean circulation.
Wind, waves, and storms: Storms, and the potentially damaging waves that accompany them, are affected by climate change in complex ways. Because different parts of the Earth are heating at different rates, the atmospheric pressure gradients that create winds are changing. In temperate zones, buoy data suggest that wave heights are increasing in some areas but decreasing in others (Gemmrich, Johannes et al. 2011), and climate models suggest that future changes in wave heights will also vary in space and by season (Zacharioudaki et al. 2011). These findings are supported by satellite altimeter measurements (Young et al. 2011) and local tide gage data (Bromirski et al. 2003). The average intensity of tropical cyclones and the frequency of very intense cyclones is expected to increase (Emanuel 2005), although total cyclone frequency could decrease. Altered wind patterns also means changes to surface currents, upwelling, temperature and nutrient stratification, etc.
Changes in coastal upwelling: The intensity and timing of coastal upwelling could be affected by climate change in a number of ways, including changes in coastal wind patterns (Bakun 1990, Bakun et al. 2010). For example, coastal Oregon has experienced substantially stronger upwelling since 2005 (Chan et al. 2008). This has led to anoxic conditions along the continental shelf with consequences for coastal fisheries resulting from large scale crab and fish die-offs. In contrast, upwelling off Peru is predicted to weaken (Bakun et al. 2010), reducing coastal productivity and having negative effects on the important anchoveta fishery.
Reduced oxygen concentration: Due to temperature-dependent solubility, warmer seawater holds less oxygen. Reduced dissolved oxygen in seawater would have obvious negative consequences for many animals. Recent evidence suggests oxygen concentration has decreased in many locations (Stramma et al. 2010). Low oxygen conditions can also result from intensified upwelling.
Sea ice loss: The arctic is one of the most dramatically changing regions of the ocean. Rapid warming of the artic (at three times the global average) is causing rapid sea ice loss (including seasonal extent, age, and depth; Fig. 4B), with enormous subsequent changes to the arctic ecosystem (Duarte et al. 2012).
 Figure 4. (A) Change in sea level and (B) decline in Arctic sea ice volume.
The Literature Cited for the entire chapter is here as a PDF

Leave a Reply