Ecofys released a new, nice graphic depicting where greenhouse gases come from:
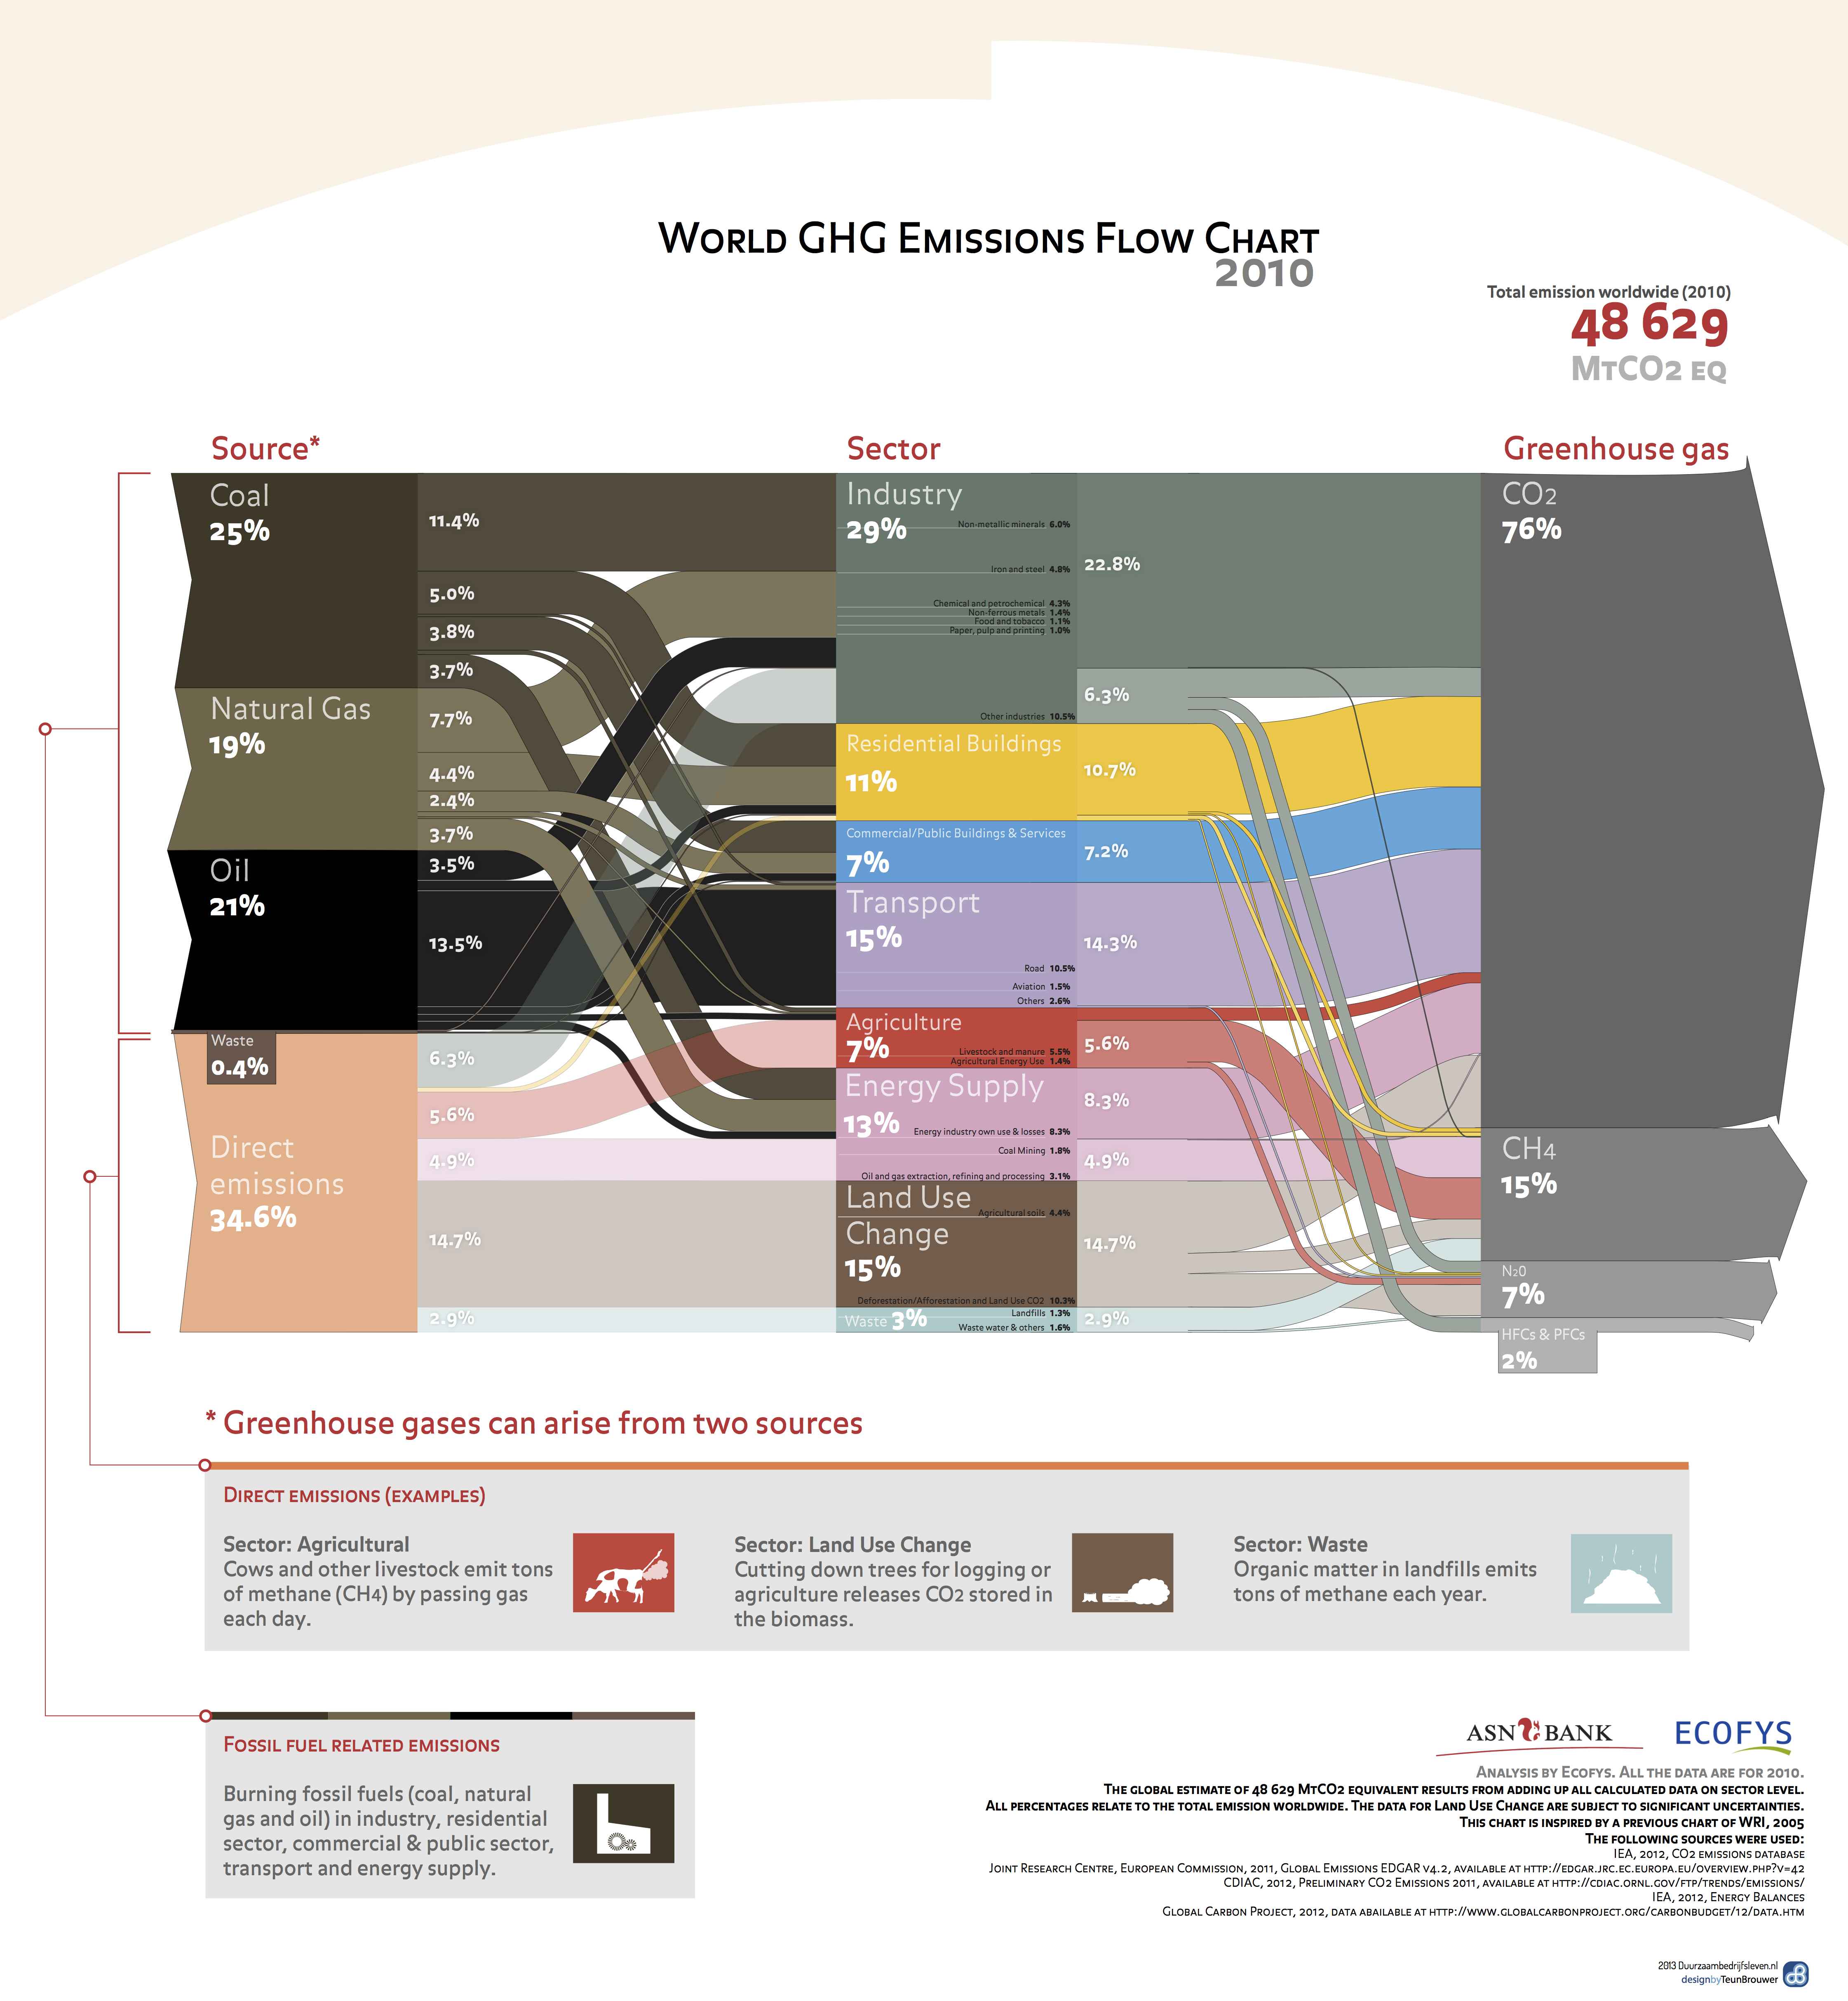
It generally seems accurate and they say it is based on 2010 data, although I have not been able to find their methodology. This chart updates an important, earlier one from WRI here. In 2000 18.2 % of emissions were attributed to land use change (mainly burning trees). WRI’s updated 2005 version reduces that to estimate 12.2% which is more in line with current (2011) estimates by the global carbon project of 9%. At 15%, I think this value in the Ecofys chart is probably too high. Yet note there are large error bars around these estimates (there is a fair amount of uncertainty).
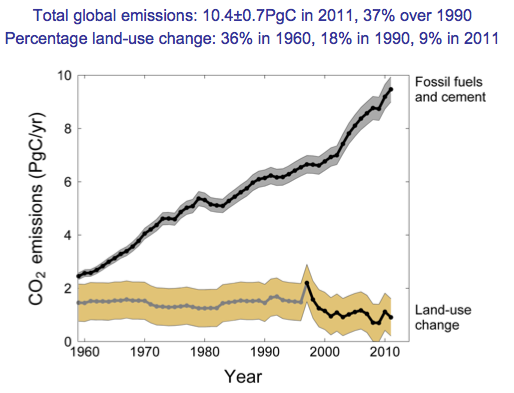
As the chart below (from Carbon Budget 2012) indicates, the absolute and relative volume of carbon emissions (CO2) from deforestation have been declining, but the relative drop is far more substantial and is due to the massive growth in emissions from other sources.
Leave a Reply